RPE Calculator — Weight from RPE & 1RM Estimator
Calculate your working weight based on RPE, estimate your 1RM, or check the RPE chart.
If you've ever opened a training program and seen something like "4×5 @ RPE 8" and stared blankly at the screen, you're not alone. That's exactly what this RPE calculator is here for. It takes three simple inputs — weight, reps, and perceived effort — and tells you either what your 1RM probably is right now, or exactly how much to load the bar for your next set. The whole thing runs on Mike Tuchscherer's Reactive Training Systems (RTS) percentage table, which has been the backbone of serious powerlifting programming for well over a decade. RPE, short for Rate of Perceived Exertion, is a 1–10 effort scale where 10 means you literally have nothing left and 8 means you could grind out two more reps if your life depended on it. Instead of chasing a fixed number regardless of how the body feels that day, RPE lets the load flex around real daily readiness — which is a smarter way to train consistently over the long haul.
What Is RPE in Strength Training?
Here's a bit of history worth knowing. The concept of rating perceived exertion goes back to a Swedish physiologist named Gunnar Borg, who developed a 6–20 scale in the 1960s primarily for endurance exercise. Doctors still use a version of that scale in cardiac rehab today. What strength athletes actually use is something quite different — a cleaner 1–10 version that powerlifting coach Mike Tuchscherer built out through his Reactive Training Systems program in the early 2000s. That system was later put through proper scientific scrutiny by researchers Dr. Eric Helms and Dr. Mike Zourdos, whose 2016 paper in the Strength and Conditioning Journal gave the method real academic credibility.
The idea itself is pretty intuitive once it clicks. Rather than just logging the weight and calling it a day, a lifter also notes how close that set came to absolute failure. That second number changes everything. The same 100 kg squat might be a comfortable RPE 7 on a good Tuesday and a grinding RPE 9 on a Thursday after a terrible night's sleep. Both sets used the same load, but they're not really the same training stimulus at all. Tracking effort alongside weight makes the log actually tell the full story.
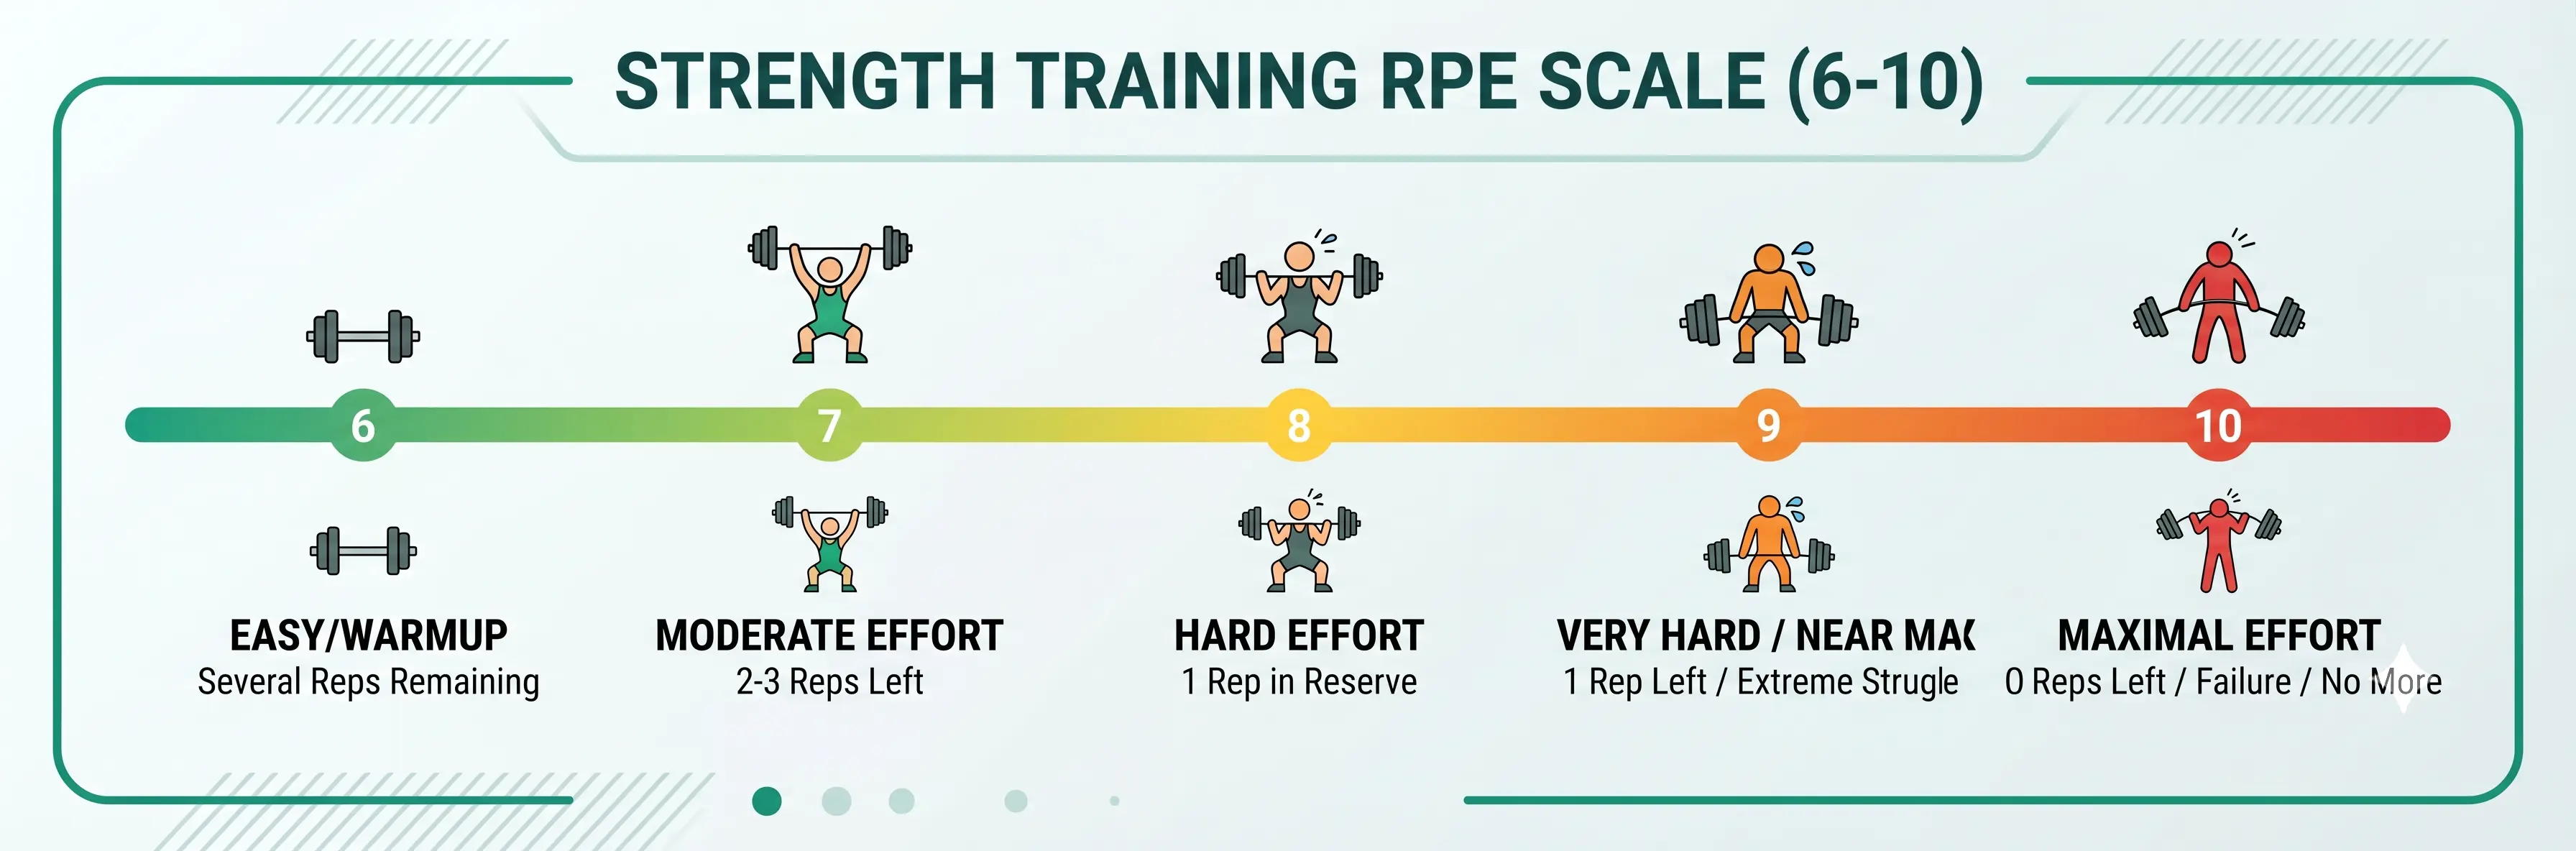
In practical terms, every RPE value corresponds to a specific number of reps that were left before failure:
- RPE 10 — Absolute max. No reps left whatsoever.
- RPE 9 — Very hard. One rep left, and it wouldn't be pretty.
- RPE 8 — Hard, but manageable. Two reps still in the tank.
- RPE 7 — Moderate effort. Three reps to spare.
- RPE 6 — Fairly easy. Basically warm-up intensity.
Anything below RPE 6 rarely gets recorded in strength training — those sets are usually just warm-ups or technique work where pushing anywhere near failure isn't the point.
The RPE Scale — Half-Points and Reps in Reserve (RIR)
Something that trips up a lot of people early on is the half-point values: 6.5, 7.5, 8.5, and 9.5. They're not overthinking it — the gap between RPE 8 and RPE 9 is genuinely meaningful when someone is programming seriously. Half-points give athletes a way to be more precise without turning every set into a philosophy debate.
The most practical way to get comfortable with the scale is through Reps in Reserve (RIR), which is exactly what it sounds like — the number of reps someone could still complete before hitting failure. The math couldn't be simpler: RPE = 10 − RIR. Done with a set and had two reps clearly left? That's RIR 2, which is RPE 8. Had one left? RPE 9. Went all the way to failure? RPE 10.
| RPE | Reps in Reserve | What It Actually Feels Like |
|---|---|---|
| 10 | 0 | True failure — nothing left |
| 9.5 | ~0.5 | Maybe a half-rep with perfect conditions |
| 9 | 1 | Very hard — one more would be a real grind |
| 8.5 | ~1.5 | Somewhere between 1 and 2 reps left |
| 8 | 2 | Hard, but two reps are clearly there |
| 7.5 | ~2.5 | On the harder side of moderate |
| 7 | 3 | Moderate — still has a few in reserve |
| 6.5 | ~3.5 | Getting comfortable |
| 6 | 4 | Easy — shouldn't be a working set |
A useful thing to know: most beginners chronically underestimate how far from failure they actually are. That's not a character flaw — it's just unfamiliarity with the scale. It improves with time and honest logging.
How to Use This RPE Calculator
The tool has three separate modes, each accessible from the tab buttons at the top. They're designed to handle different situations, so here's a quick walkthrough of all three.
Tab 1: Find Your Working Weight (Weight from RPE)
This is the most common situation — a program prescribes something like "5 reps @ RPE 8" and the lifter needs to know what weight to actually put on the bar.
- Use the toggle at the top to switch between kg and lb — it updates everything automatically.
- Enter the 1RM or Training Max in the first field. If this number isn't known, go to Tab 2 first to estimate it.
- Set the Target Reps anywhere from 1 to 12.
- Pick the Target RPE from the dropdown — values run from 6 to 10 in 0.5 steps.
- Hit Calculate. The result shows the working weight along with its percentage of 1RM.
Quick example: 1RM = 100 kg, want 5 reps @ RPE 8 → Load up 81.1 kg (that's 81.1% of 1RM).
Tab 2: Estimate Your 1RM from a Recent Set
This one works backwards from something that already happened. It's especially handy for lifters who've never actually tested their 1RM, or who want a current estimate without doing an all-out max attempt mid-training block.
- Enter the weight that was lifted.
- Enter the number of reps completed.
- Select the RPE of that set from the dropdown — this is where being honest matters. The result is only as good as the input.
- Press Calculate to get the estimated 1RM (e1RM).
- There's also a button to immediately carry that e1RM into Tab 1 — so the whole chain from "what did I just do" to "what should I do next" takes about ten seconds.
Quick example: Squatted 80 kg × 5 at RPE 8 → e1RM comes out to roughly 98.6 kg.
Tab 3: Browse the Full RPE Chart
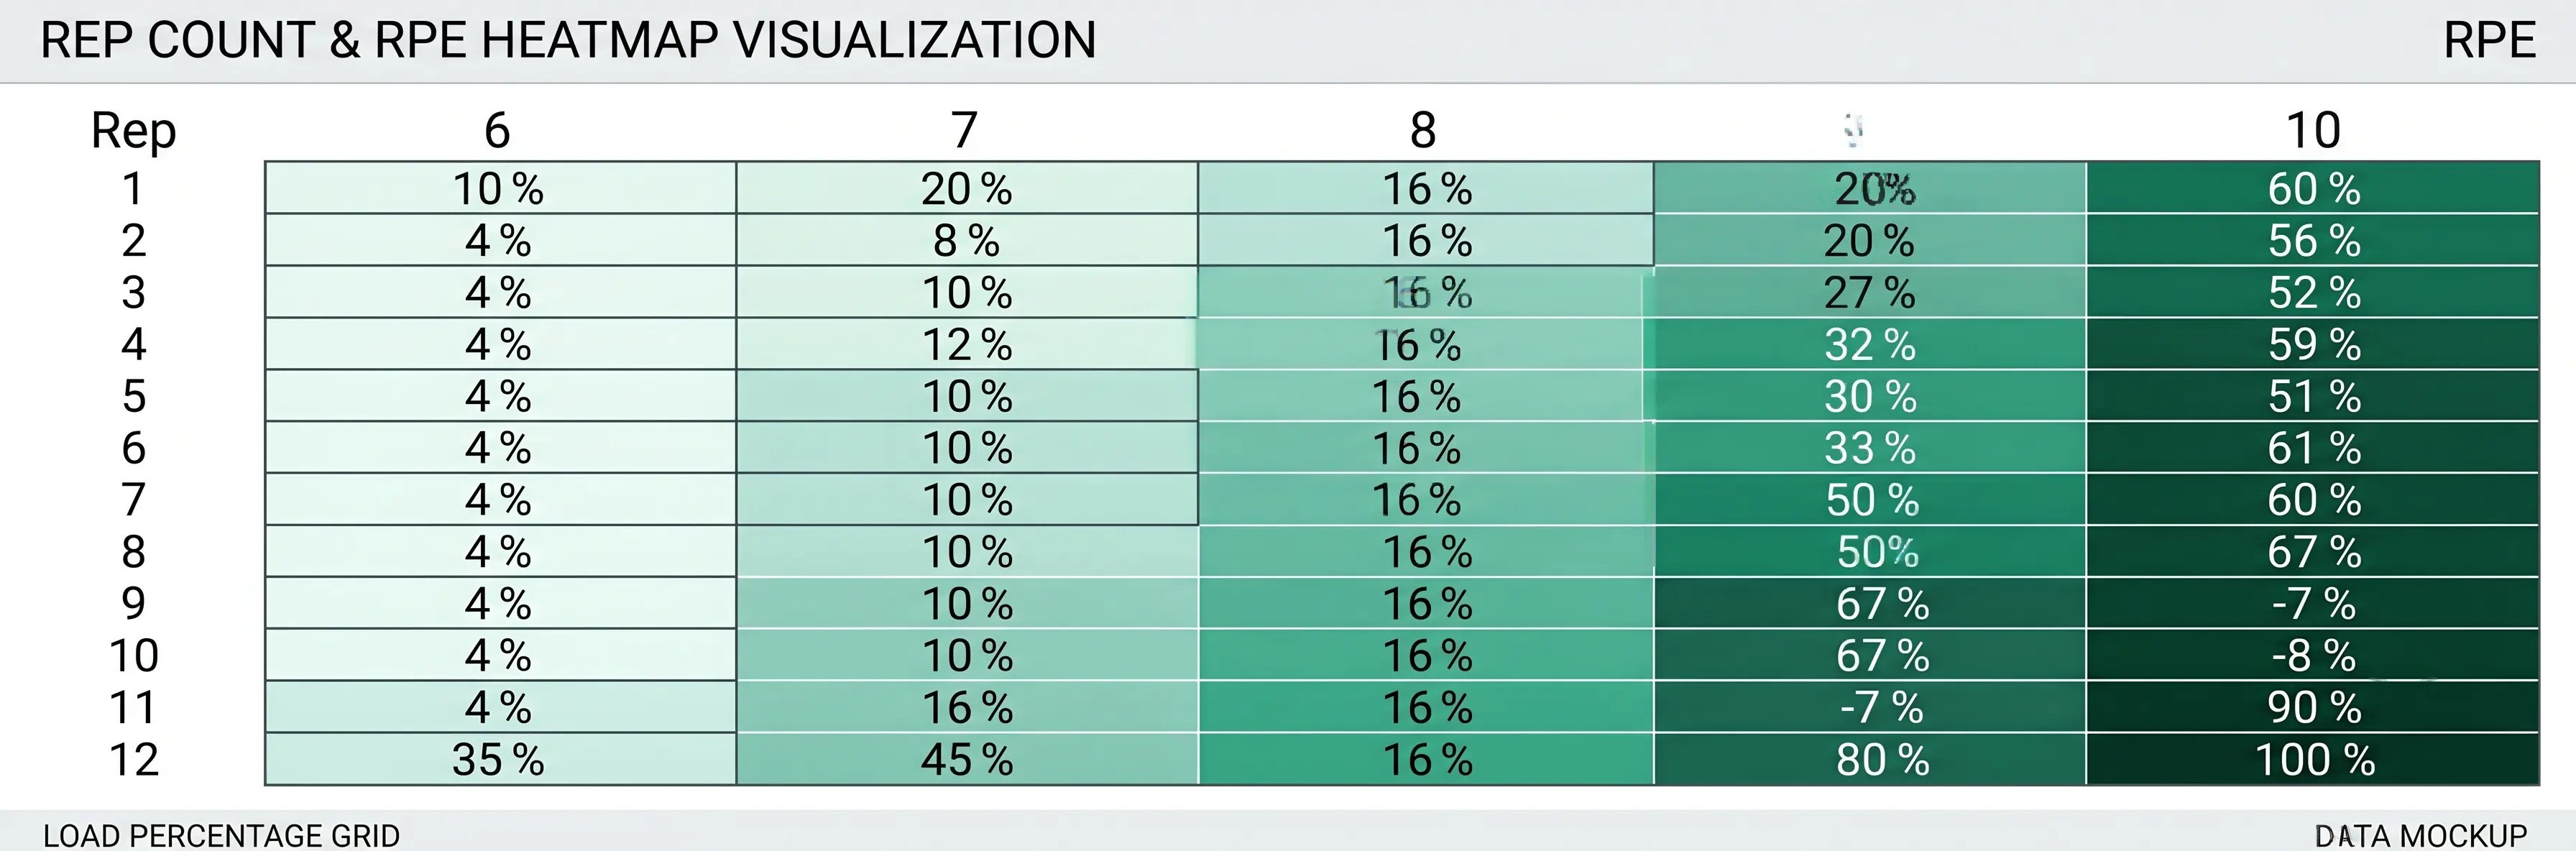
No inputs needed here at all. This tab shows the complete Tuchscherer percentage table — every combination of reps (1–12) and RPE (6 through 10 in 0.5 steps). There are two display modes: a List view that filters by either rep count or RPE level, and a Grid view that lays the whole table out at once for quick reference. The grid is particularly useful when planning an entire training block and wanting to see how loads shift across different intensity zones at a glance.
How the RPE Calculator Actually Works — The Math
Some tools are a black box. This one doesn't need to be.
The calculations are grounded in the Tuchscherer RTS percentage table — the same reference that serious powerlifting coaches and programs have been using for years. Every cell in that table is a specific percentage of a lifter's 1RM, tied to a combination of rep count and RPE. Five reps at RPE 8, for instance, equals 81.1% of 1RM. Three reps at RPE 9 equals 89.2%.
The calculator runs two operations:
Using the example from above: 80 kg ÷ 0.811 gives an e1RM of roughly 98.6 kg.
Want 3 reps at RPE 9 from that e1RM? 98.6 kg × 0.892 lands at about 87.9 kg.
A few honest caveats on accuracy: for experienced lifters rating effort consistently on sets of 1–5 reps, results tend to come within about 5% of a real tested 1RM. That window gets wider with higher-rep sets — at 10 or 12 reps, perceived effort often peaks before true muscular failure does, which skews the estimate. The calculator is a reliable training guide, not a crystal ball. It gets meaningfully more accurate as the lifter gets better at rating RPE consistently over time. If you want to work the percentage math separately, the Percent Increase Calculator handles that kind of calculation directly.
Reading the RPE Percentage Chart
The percentage chart is what connects effort to actual load prescription — and once a lifter understands how to read it, planning a training block gets a lot easier.
Each value in the chart answers the question: for a given 1RM, what weight corresponds to X reps at Y effort level? A few cells worth knowing off the top:
- 1 rep @ RPE 10 = 100% — this is definitionally the 1RM, so no surprise there.
- 5 reps @ RPE 8 = 81.1% — probably the single most common training zone in strength work.
- 3 reps @ RPE 9 = 89.2% — heavier strength sets, getting close to competition intensity.
- 8 reps @ RPE 7 = 73.9% — solid volume work, enough stimulus without beating up recovery.
- 12 reps @ RPE 8 = 62.6% — higher-rep hypertrophy accumulation.
What jumps out when looking at the full table is how consistently load shifts as RPE and rep count move. Going from RPE 8 to RPE 9 at the same rep count adds roughly 3–5% to the bar. Adding reps at the same RPE drops the load by a similar margin. Understanding these relationships helps with building smart waves of intensity across a training block rather than just picking weights by feel.
The RPE Chart tab in the calculator above shows the entire table — either by filtering per rep or RPE value in list mode, or as a full grid.
Percentage-based programming has been around forever and it works. The setup is simple: take a tested 1RM, multiply by a percentage, lift that weight. Predictable, easy to plan around, easy to communicate to athletes. That's genuinely useful, especially early in a lifting career when performance is relatively consistent and predictable.
The catch is that a 1RM isn't a fixed number. It shifts day to day depending on sleep quality, stress load, nutrition, how many hard sessions came before it in the week, and a dozen other things. When someone's running on four hours of sleep and their program says to lift 85% of a max that was tested three weeks ago under ideal conditions — that 85% is now functioning more like 92% or 95% of what they can actually produce today. That's where percentage programming breaks down.
RPE handles this through autoregulation. The effort target stays constant; the load adjusts to match what the body can actually do. A strong day means more weight on the bar at the same RPE. A beat-up day means less — and that's not failure, that's the system working correctly.
| Percentage-Based | RPE-Based | |
|---|---|---|
| Adjusts to daily readiness | ❌ | ✅ |
| Requires a current 1RM test | ✅ | ❌ |
| Works well for beginners | ✅ | Takes practice |
| Accounts for fatigue accumulation | ❌ | ✅ |
| Better fit for | Beginners / peaking blocks | Intermediate to advanced / hypertrophy |
In practice, the best programs don't pick one and ignore the other. They use percentages to build the overall structure and RPE to make real-time adjustments when the body isn't cooperating with what was planned. The calculator fits naturally into that approach — plug in a known 1RM, get a percentage-based starting weight, then use RPE to verify whether that load actually matches today's capacity. For a deeper dive into how this plays out in real programming, Barbell Medicine's detailed breakdown of autoregulation and RPE in strength training is one of the clearest practical guides available.
What RPE Should You Be Training At?
This is where it gets practical. The right target effort zone depends on what the training is actually trying to accomplish.
For Strength and Powerlifting
Main working sets on compound lifts — squat, bench, deadlift — typically sit around RPE 8 to 9. That range produces a strong neural and muscular stimulus without pushing recovery into a hole that takes days to climb out of.
Heavy singles and near-maximal strength sets usually land at RPE 9 to 9.5 in training. Going to a true RPE 10 regularly isn't a great idea — form tends to deteriorate, injury risk climbs, and the fatigue cost rarely pays off proportionally in strength gains. Save RPE 10 for competition or an occasional genuine max test.
For Muscle Building
Hypertrophy research points pretty clearly to proximity to failure as the key driver of muscle growth. Sets that stay well below RPE 7 — meaning more than three reps from failure — don't tend to produce meaningful adaptation, particularly on isolation exercises. The effective range for most muscle-building work sits between RPE 7 and 9.
Compound movements like rows, pressing variations, and squats work well at RPE 7–8, leaving two to three reps in reserve and keeping total session fatigue manageable. Isolation work like curls, flyes, or lateral raises can often be pushed to RPE 8–9 without much recovery cost, since the muscles involved are smaller and the systemic demand is lower.
For Backoff Sets and Volume Accumulation
After a heavy top set, backoff sets are a way to pile on volume without the same fatigue cost. A common setup: if the top set was 5 reps at RPE 9, the backoff sets drop to RPE 7 to 7.5 for the same rep count. It's still hard enough to be useful — just not hard enough to wreck the rest of the session or the week.
Use Tab 1 of the calculator to work these out. Same rep count, lower target RPE — the weight comes back instantly.
For Deload Weeks
Deloads are supposed to be recovery weeks, not vacations from the gym. Targeting RPE 5 to 7 keeps technique sharp and movement patterns grooved without accumulating meaningful fatigue. The calculator makes this precise — enter the 1RM, pick the deload rep range, dial down the RPE, and the bar weight follows.
RPE for Powerlifting — Squat, Bench, and Deadlift Specifically
The Tuchscherer table was originally built with the powerlifting competition lifts in mind, so it maps particularly well to squat, bench press, and deadlift programming. That said, the calculator is lift-agnostic — the same math applies to overhead press, Romanian deadlifts, front squats, or anything else on a barbell.
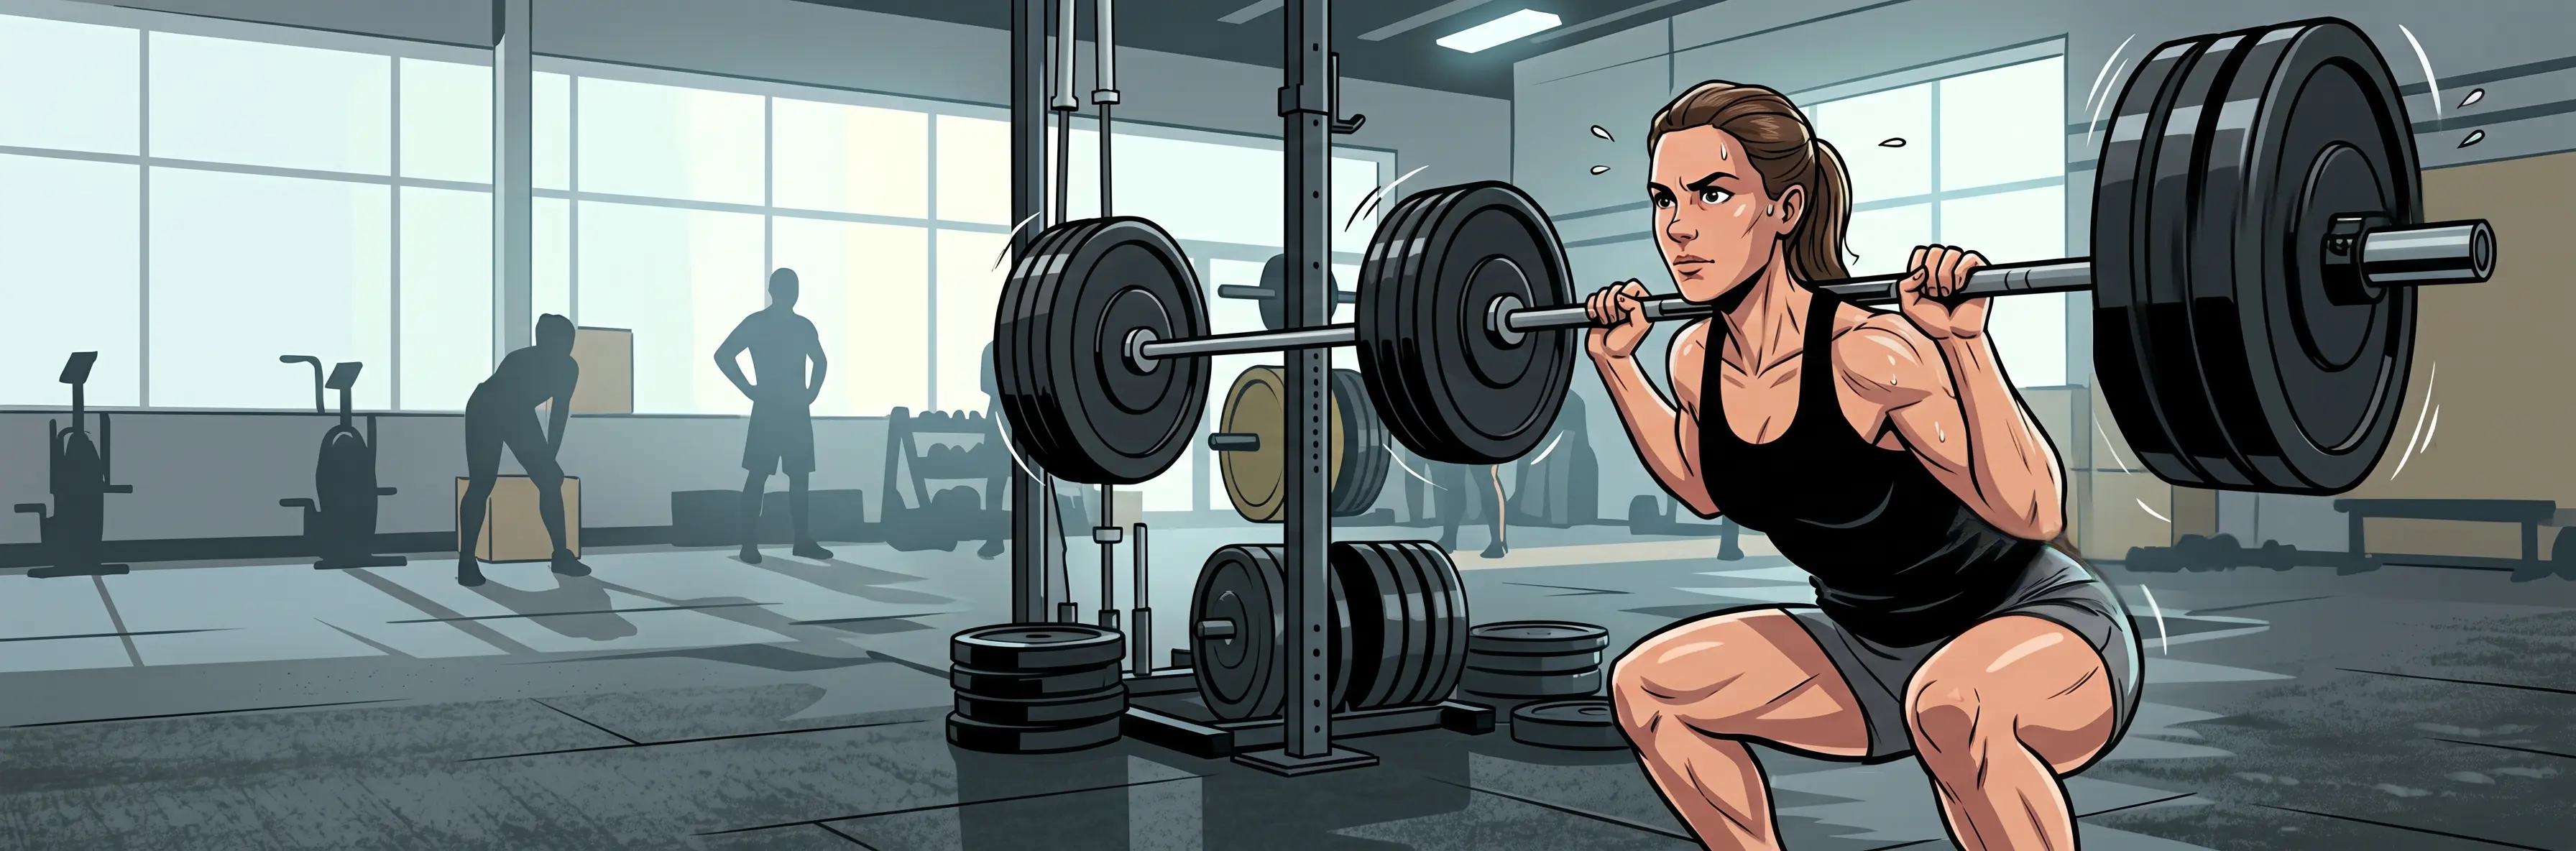
One thing worth knowing: RPE doesn't transfer cleanly between exercises automatically. The deadlift has a very different fatigue signature from the bench press — breathing demands, bracing complexity, and the muscles involved all differ. What registers as RPE 8 on a deadlift might feel nothing like RPE 8 on a close-grip bench. Keeping separate calibrations per lift over time produces far more reliable data than assuming one rating applies everywhere.
For meet prep, most coaches keep the heaviest training sets at RPE 9 to 9.5 in the final weeks — enough to prime the nervous system and get a real read on current strength, without leaving the lifter drained heading into competition day.
7 Tips That Will Actually Make Your RPE Ratings More Accurate
Better ratings mean better data, and better data means better training decisions. These habits make a real difference:
- Rate the set immediately — not a minute later. The sense of effort fades surprisingly fast. Ratings logged 60+ seconds after a set are almost always lower than they should be.
- Ask the question that actually works. The most reliable internal prompt: "Right now, if I had to, how many more clean reps could I actually get?" Answering that honestly is the whole system. Everything else follows.
- Beginners almost always underestimate. It's not a failure of willpower — it's just inexperience with the scale. Most new lifters think they're at a 9 when they're actually at a 7. Video sets and check if the bar speed and form are consistent with how close to failure the rating suggests.
- High-rep sets are genuinely harder to judge. RPE is most reliable in the 1–6 rep range. At 10 or 12 reps, the burn and cardiovascular demand often make a set feel maximal before the muscles actually are. For those sets, lean conservative with ratings.
- Fatigue builds within a session — that's normal. The same weight and reps will feel harder on set 5 than on set 1. RPE rising across sets isn't a sign something's wrong — it's exactly the kind of information the system is supposed to capture.
- Sloppy form inflates RPE artificially. If technique deteriorates mid-set — depth cuts out, the bar path wanders, breathing gets erratic — the set feels harder than it should. Consistent technique is what makes RPE data comparable across sessions and weeks.
- Calibrate by lift, not just by session. A deadlift at RPE 8 and a bench press at RPE 8 might not reflect equal proximity to failure for a given lifter. Keeping separate mental baselines per movement is what turns good RPE tracking into genuinely useful programming data.
Frequently Asked Questions
What is an RPE calculator used for?
An RPE calculator converts perceived effort into actual training loads — or works in reverse to estimate a 1RM from a recent set. For someone following effort-based programming, it answers "what do I actually load?" For someone without a current tested max, it produces a working estimate without requiring an all-out attempt. Both uses make it a practical daily tool rather than just a static reference.
What does RPE 8 mean in the gym?
RPE 8 means the set was hard, but two more reps were clearly available before failure. It's the most commonly programmed training intensity because it's demanding enough to drive real adaptation while leaving enough reserve to recover well and maintain quality across a full week of training.
What is the difference between RPE and RIR?
They're two ways of describing the same thing. RIR, or Reps in Reserve, counts how many reps are left before failure. RPE counts how hard the set felt on a 1–10 scale. The relationship is direct: RPE = 10 − RIR. Two reps left means RIR 2, which equals RPE 8. Some people find RIR more intuitive to judge during a set; RPE shows up more often in written programs. Both systems point to the same underlying effort level.
What does e1RM mean?
e1RM stands for estimated one-rep maximum — a theoretical max calculated from a submaximal set rather than an actual all-out attempt. Lifting 80 kg for 5 reps at RPE 8 produces an e1RM of roughly 98.6 kg using the Tuchscherer table. The calculator uses that figure as the anchor for all subsequent weight recommendations. e1RM and true 1RM aren't always identical, but for day-to-day programming they're close enough — and far safer to obtain regularly.
Is RPE training better than percentage-based training?
Neither one wins cleanly — they solve different problems. Percentage-based training is simpler and works great when a lifter's strength is relatively predictable. RPE handles the reality that performance varies day to day due to sleep, stress, and accumulated fatigue, which percentages can't account for without constant 1RM retesting. Most well-designed intermediate and advanced programs use both together: percentages to establish the general loading framework, RPE to make it practical on any given training day.
What RPE is best for muscle growth?
Research consistently points to proximity to failure as a key driver of hypertrophy. For most people, the effective range for muscle-building sets lands between RPE 7 and 9, meaning 1–3 reps in reserve. Below RPE 7, sets are generally too far from failure to deliver a meaningful growth stimulus — especially for smaller muscle groups. Grinding out every set to absolute failure (RPE 10) works against the goal too, because the recovery cost outpaces the benefit pretty quickly when done repeatedly.
How accurate is this RPE calculator?
For experienced lifters rating effort honestly on shorter sets — particularly 1 to 5 reps — the e1RM estimate tends to land within roughly 5% of a real tested maximum. That's accurate enough to be genuinely useful for programming. Accuracy drops off for higher-rep sets, because perceived exertion tends to plateau before the muscles actually do. The more consistently someone applies the scale across time, the more useful and precise the outputs become.
Who developed the RPE system used in strength training?
The weightlifting-specific 1–10 RPE scale was developed by powerlifting coach Mike Tuchscherer through Reactive Training Systems (RTS) in the early 2000s. The percentage table it generates was later validated scientifically through research by Dr. Eric Helms and Dr. Mike Zourdos, published in the Strength and Conditioning Journal in 2016 — the Helms et al. (2016) paper remains the primary academic reference for RIR-based RPE in resistance training. That research helped bring RPE into mainstream evidence-based programming well beyond the powerlifting community.
Does this RPE calculator work for running or cardio?
No — and knowing why helps avoid confusion. The strength training RPE scale is based on reps in reserve and runs from 1 to 10. The Borg scale used in endurance sports runs from 6 to 20 and correlates with heart rate rather than reps. For running, a rough shortcut is to multiply the Borg rating by 10 to estimate heart rate (Borg 14 ≈ 140 bpm). This calculator is built specifically around resistance training and produces reliable results for barbell and strength movements only.
Can this tool be used for both bench press and squat?
Yes — the calculator doesn't care which exercise is being trained. The math applies to any barbell or strength movement. The one thing worth keeping in mind is that RPE calibration often differs between lifts. A lifter who's been squatting for five years usually reads squat RPE very accurately, while the same person might be less precise on the deadlift if it's a newer movement for them. Tracking RPE per lift, rather than applying a single blanket rating, is what makes the data most useful over time.
What is the RPE percentage chart and where does it come from?
The RPE percentage chart maps every combination of rep count (1–12) and RPE (6–10 in 0.5 steps) to a corresponding percentage of a lifter's 1RM. The values come from the Reactive Training Systems methodology developed by Mike Tuchscherer. For example, 5 reps at RPE 8 corresponds to 81.1% of 1RM; 3 reps at RPE 9 equals 89.2%. The RPE Chart tab in the calculator above displays the complete table in both list and grid format.